This article explains the basic concept of correlation without requiring a lot of technical knowledge. It also explains how correlations can be used to identify "drivers" of employee engagement in order to understand employee survey results at a deeper level.
In statistics, correlation is defined as an interdependence of variable quantities. For the less mathematically inclined among us, just think of correlation as a relationship or connection between two or more things.
Correlation is a statistic that measures the linear relationship between two variables (survey items). The numeric values for correlations are known as correlation coefficients and are commonly represented by the letter "r". The range of possible values for r is from -1.0 to +1.0. Numbers less than zero represent a negative relationship between variables and numbers greater than zero represent a positive relationship.
You can think of the value of "r" almost like a percentage. If r = 0, there is no statistical relationship between two variables. If r = 1, there is a perfect (i.e. 100%) correlation between the two variables. Higher values indicate stronger correlations. How high "r" needs to be in order to be statistically significant depends on how many data points are included in the calculation. With fewer data points, a higher correlation is needed to achieve statistical significance. In other words, survey results from small demographic groups need to have stronger correlations in order to be considered statistically significant. (The data analytics on this web site use a t-test to ensure only statistically signficant results are displayed.)
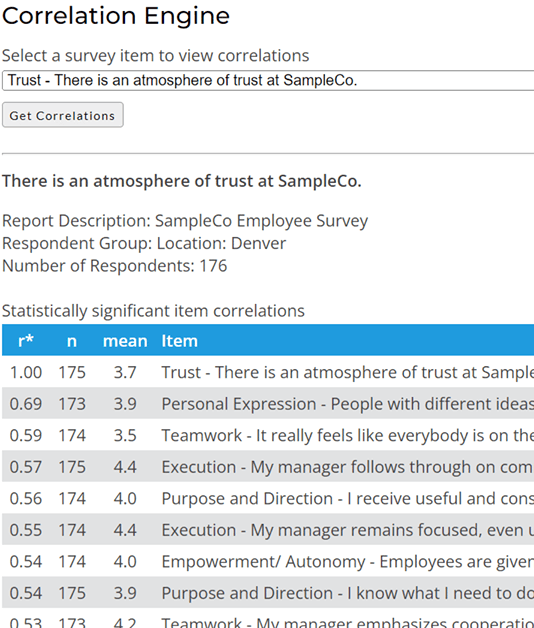
Correlation can be used to better understand what drives employee satisfaction or employee engagement within organizations. The following sample output from our Correlation Engine shows how you might use correlations with your employee survey results. You can select any Likert rating scale item (e.g. 5-point rating) from your survey to view the items from your survey that correlate with the selected item. In this example, we are looking at the survey questions that are most correlated with trust, which is a good proxy for overall employee satisfaction and employee engagement.
It is important to note that correlation cannot determine cause and effect. Correlation can only indicate the strength of the statistical relationship between two survey questions. It can't tell us whether of those items is influencing the other item. (In some cases, there could even be a third, unmeasured factor that is the real cause of the observed correlation between two survey items.)
For a more comprehensive discussion on correlation and causation, see Wikipedia's synopsis.
We generally assume that overall satisfaction or overall engagement is the effect, and that any survey questions that correlate with these concepts are the cause. This is a logical and safe assumption for overall satisfaction, especially if the survey covers a comprehensive list of areas related to employee satisfaction. However, when looking at correlations between other survey questions, it is important to keep the cause-effect uncertainty in mind. Logic will often give you a good idea of which item is the likely cause and which item is the effect, but not always.
Statistical Significance (p-level) and Number of Respondents ("n")
When correlation data is presented, it is usually accompanied by something like the following in a footnote somewhere:
Correlations (r) significant at p < 0.05. This is a customary indication of the likelihood that the observed correlations are a result of chance. For our purposes, we have set this probability (p) threshold to be no more than 0.05 or 5%. There is less than a 5% likelihood that the correlations listed here are a result of chance.
Whenever you view correlations, it is important to look for this p-level. You don't need to understand more about it than is explained here. Just know that "p < 0.05" is the most common standard threshold for statistical significance.
"n" indicates the total number of respondents. This is important for statistical significance because when you have a large n, a smaller correlation can still be statistically significant. Conversely, with a small n, you need a much larger correlation for statistical significance. If you are looking at two sets of correlations that have very different numbers of respondents, you can NOT compare the correlation coefficients from each list to one another. You need to look at each list independently and draw conclusions only within each list.
The most common way that correlation is used in most surveys is to try to understand what matters most to people by correlating survey items with some measure of overall satisfaction. As you've seen in the examples above, this is a technique that you can use without worrying about all the technical details. Just start at the top of the list to see what matters most. Remember to also look at the bottom of the list for high negative correlations. While less common on our employee surveys, they are just as important as high positive correlations. A negative correlation indicates an inverse relationship between items.